Cluster history
This guide should help administrators and consultants tackle issues in Pacemaker cluster installations. We concentrate on troubleshooting and analysis methods with the crmsh history.
Cluster leaves numerous traces behind, more than any other system. The logs and the rest are spread among all cluster nodes and multiple directories. The obvious difficulty is to show that information in a consolidated manner. This is where crmsh history helps.
Hopefully, the guide will help you investigate your specific issue with more efficiency and less effort.
Sample cluster
In [Listing 1] a modestly complex sample cluster is shown with which we can experiment and break in some hopefully instructive ways.
|
|
We won’t be going into how to setup nodes or configure the cluster. For that, please refer to the Getting Started document. |
If you’re new to clusters, that configuration may look overwhelming. A graphical presentation in [Image 1] of the essential elements and relations between them is easier on the eye (and the mind).
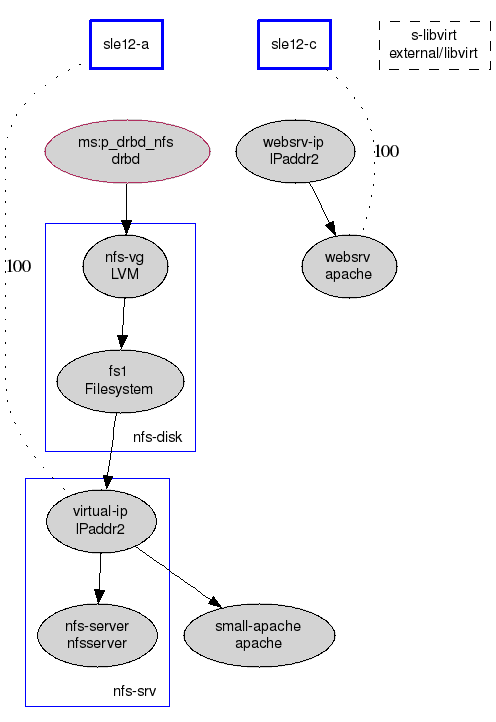
As homework, try to match the two cluster representations.
Quick (& dirty) start
For the impatient, we give here a few examples of history use.
Most of the time you will be dealing with various resource (a.k.a. application) induced phenomena. For instance, while preparing this document we noticed that a probe failed repeatedly on a node which wasn’t even running the resource [Listing 2].
The history resource command shows log messages relevant to the supplied resource [Listing 3].
| NFS server error message. | |
| Warning about a non-existing user id. |
|
|
Messages logged by resource agents are always tagged with
type(ID) (in [Listing 3]: nfsserver(nfs-server)).
Everything dumped to stderr/stdout (in [Listing 3]: id: rpcuser: no such user) is captured and subsequently logged by lrmd. The stdout output is at the info severity which is by default not logged by pacemaker since version 1.1.12. |
At the very top we see error message reporting that the NFS server is running, but some other stuff, apparently unexpectedly, is not. However, we know that it cannot be running on the c node as it is already running on the a node. Not being able to figure out what is going on, we had to turn on tracing of the resource agent. [Listing 4] shows how to do that.
Trace of the nfsserver RA revealed that the nfs-server init script (used internally by the resource agent) always exits with success for status. That was actually due to the recent port to systemd and erroneous interpretation of systemctl status semantics: it always exits with success (due to some paradigm shift, we guess). FYI, systemctl is-active should be used instead and it does report a service status as expected.
As a bonus, a minor issue about a non-existing user id rpcuser is also revealed.
|
|
Messages in the crm history log output are colored depending on the originating host. |
The rest of this document gives more details about crmsh history. If you’re more of a just-try-it-out person, enter crm history and experiment. With history commands you cannot really break anything (fingers crossed).
Introduction to crmsh history
The history crmsh feature, as the name suggests, deals with the past. It was conceived as a facility to bring to the fore all trails pacemaker cluster leaves behind which are relevant to a particular resource, node, or event. It is used in the first place as a troubleshooting tool, but it can also be helpful in studying pacemaker clusters.
To begin, we run the info command which gives an overview, as shown in [Listing 5].
The timeframe command limits the observed period and helps focus on the events of interest. Here we wanted to look at the 10 minute period. Two transitions were executed during this time.
Transitions
Transitions are basic units capturing cluster movements (resource operations and node events). A transition consists of a set of actions to reach a desired cluster status as specified in the cluster configuration by the user.
Every configuration or status change results in a transition.
Every transition is also a CIB, which is how cluster configuration and status are stored. Transitions are saved to files, the so called PE (Policy Engine) inputs.
In [Listing 6] we show how to display transitions. The listing is annotated to explain the output in more detail.
| The transition command without arguments displays the latest transition. | |
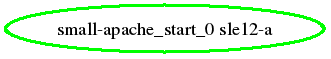
| Graph of transition actions is provided by graphviz. See [Image 2]. | |
| Output of crm_simulate with irrelevant stuff edited out. crm_simulate was formerly known as ptest. | |
| Transition summary followed by selection of log messages. History weeds out messages which are of lesser importance. See [Listing 8] if you want to see what history has been hiding from you here. |
Incidentally, if you wonder why all transitions in these examples are green, that is not because they were green in any sense of the color, but just due to that being color of node c: as chance would have it, c was calling shots at the time (being Designated Coordinator or DC). That is also why all crmd and pengine messages are coming from c.
|
|
Transitions are the basis of pacemaker operation, make sure that you understand them. |
What you cannot see in the listing is a graph generated and shown in a separate window in your X11 display. [Image 2] may not be very involved, but we reckon it’s as good a start as starts go.
It may sometimes be useful to see what changed between two transitions. History diff command is in action in [Listing 7].
| Configuration diff between two last transitions. Transitions may be referenced with indexes starting at 0 and going backwards. | |
| Status diff between two last transitions. |
Whereas configuration diff is (hopefully) obvious, status diff needs some explanation: the status section of the PE inputs (transitions) always lags behind the configuration. This is because at the time the transition is saved to a file, the actions of that transition are yet to be executed. So, the status section of transition N corresponds to the configuration N-1.
Resource and node events
Apart from transitions, events such as resource start or stop are what we usually want to examine. In our extremely exciting example of apache resource restart, the history resource command picks the most interesting resource related messages as shown in [Listing 9]. Again, history shows only the most important log parts.
|
|
If you want to see more detail (which may not always be recommendable), then use the history detail command to increase the level of detail displayed. |
Node related events are node start and stop (cluster-wise), node membership changes, and stonith events (aka node fence). We’ll refrain from showing examples of the history node command—it is analogue to the resource command.
Viewing logs
History log command, unsurprisingly, displays logs. The messages from various nodes are weaved and shown in different colors for the sake of easier viewing. Unlike other history commands, log shows all messages captured in the report. If you find some of them irrelevant they can be filtered out: the exclude command takes extended regular expressions and it is additive. We usually set the exclude expression to at least ssh|systemd|kernel. Use exclude clear to remove all expressions. And don’t forget the timeframe command that imposes a time window on the report.
External reports, configurations, and graphs
The information source history works with is hb_report generated report. Even when examining live cluster, hb_report is run behind the scene to collect the data before presenting it to the user. Well, at least to generate the first report: there is a special procedure for log refreshing and collecting new PE inputs, which runs much faster than creating a report from scratch. However, juggling with multiple sources, appending logs, moving time windows, may not always be foolproof, and if the source gets borked you can always ask for a brand new report with refresh force.
Analyzing reports from external source is no different from what we’ve seen so far. In fact, there’s a source command which tells history where to look for data.
